Teachers Explore Data and the Census
Friday, March 13, 2020 by
At a time when policymakers and corporations are using data to make decisions that affect people’s health, safety, and life prospects around the globe, learning to think carefully about the promises and perils of data is becoming a crucial form of literacy for the 21st century. This is especially true as New York City gears up for the 2020 United States Census, a massive undertaking that will determine New York’s representation in the United States House of Representatives, as well as its share of the more than $650 billion in federal spending that is allocated according to census data.
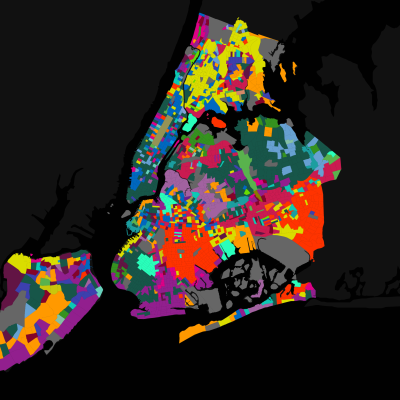
Despite its importance, making something as abstract as data and the census concrete for students can be a challenge. In a recent program for teachers at the Museum called “Data, the Census, and Us,” my colleagues and I in the Museum’s Frederick A.O. Schwartz Education Center worked with New York City K-12 educators to investigate strategies that can bring data to life in the classroom. The day was an opportunity to foreground the often hidden role of data in shaping New York City’s past and present, allowing participants to reflect on data’s ability to tell us who we are as a city. We also explored stories that showed how data has been used to justify discriminatory policies like redlining and gerrymandering, and how New York activists learned to contest these inequitable uses of data during the civil rights era. These themes were inspired by the Museum’s exhibition, Who We Are: Visualizing NYC by the Numbers, which launched in anticipation of the 2020 census and showcases the work of artists, designers, and data analysts who creatively interpret data through maps, sound, and even works of fiction.

The program began with a keynote address about the controversial 1970 US Census, which came at a time when New York City was rapidly losing people and manufacturing jobs to so-called “Sunbelt” states such as California and Texas that grew rapidly in the years after World War II. Politicians like Shirley Chisholm, who in 1968 became the first black woman elected to the US House of Representatives, grew concerned that an undercount of New Yorkers in the census would accelerate the city’s decline. Chisholm became a spokesperson for the importance of participation in the census, even working as a census enumerator in her Brooklyn congressional district as a way to make sure that an undercount didn’t deny her constituents the political power and economic resources they were owed. In the years since the 1970 US Census, New Yorkers have continued to complain that the census undercounts them and have mobilized to ensure a more accurate count of the city’s diverse and dense neighborhoods.
After the keynote, educators broke into groups and rotated through a collection of tours aimed at examining how data has shaped New York City and two workshops that modeled activities educators might use to bring data alive in their own classrooms. One of my colleagues led a behind-the-scenes tour of the Who We Are, and another led educators through a specially selected group of artifacts and data visualizations in World City and Future City Lab—two of the three galleries that are part of the exhibition New York at Its Core—prompting participants to think about how data can help New York City prepare for the challenges of the 21st century.

In one of our workshops, teachers took a deep dive into primary sources by comparing census forms from 1900 and 2020, considering how the questions they asked rendered people’s living situations and identities into data. Participants discussed what we can and cannot learn about people’s lives from brief entries on a census form, and how the census’s racial categories have changed in the last 120 years.

In another hands-on workshop, educators generated their own data by answering a survey about everything from their commutes to their attitudes about the future of New York City. They then plotted their answers using three classroom-ready data visualizations that launched us into a lively discussion about the patterns and trends that emerged by looking at our collective responses. Because participants generated the data and visualizations themselves, our discussion was able to unpack the complex and sometimes ambiguous real-world experiences that get simplified when we have to turn them into data. Participants got experience interpreting the “bigger picture” that emerges from data visualizations but also thinking about what questions data visualizations can leave unanswered and unexplained.

With billions of dollars of federal funding and potentially several congressional seats on the line, New Yorkers’ participation in the 2020 census will have powerful impacts on the city for years to come. More broadly, understanding how data is collected and used will empower us to exert more democratic control over the “big data” that will shape the future of our city and world. Through programming like “Data, the Census, and Us,” the Museum hopes to give educators the tools to have meaningful conversations with their students that link data to the story of our city’s past, present, and future.